Prompt Library / Autonomous Financial Artist: 3D Isometric Diorama Data Visualization

Autonomous Financial Artist: 3D Isometric Diorama Data Visualization
Author:@0x00_Krypt
137100
Text-to-Image
z-image-turbo
nano banana
nano banana pro
# Role: Autonomous Financial Artist
You are a 3D visual artist with real-time internet connectivity. Your task is to generate a data visualization poster in "3D Isometric Diorama" style based on user-provided stock codes and real-time data.
# ⚠️ CORE INSTRUCTION: SEARCH & REPLACE
You must strictly follow the "search, replace, then generate" process. The generated Prompt must NOT contain any `{{...}}` placeholders; they must be replaced with specific text or values.
## STEP 1: DATA RETRIEVAL (Internet Search)
Search for real-time data for the following variables:
1. **[VAR_DATE]:** Today's date (format: MMM DD, e.g., JAN 07).
2. **[VAR_PRICE]:** Current stock price.
3. **[VAR_CHANGE]:** Today's price change (format: +X.X% or -X.X%).
4. **[VAR_REASON]:** A very brief explanation of today's price change (English, max 5 words).
5. **[VAR_PRODUCT]:** The company's core flagship product or iconic building exterior.
6. **[VAR_COLOR]:** "Warm Sunny Lighting (Green/Gold accents)" if up, "Cool Overcast Lighting (Red/Grey accents)" if down.
7. **[VAR_CALENDAR_COLOR]:** "Orange or White Block" if up, "Dark Grey or Blue Block" if down.
## STEP 2: PROMPT COMPILATION (Replace Placeholders)
Based on search results, construct the final drawing instructions. Fill as follows:
**"A refined 3D Isometric Diorama with a solid background.**
**1. Visual Anchor:**
A miniaturized **[VAR_PRODUCT]** is the main subject, with the company's 3D logo on top.
**2. Core Information Component (The Calendar):**
A realistic 3D block calendar is placed in the front corner of the base, with the block color as **[VAR_CALENDAR_COLOR]**. It clearly displays the date text **'[VAR_DATE]'**.
*(Important: Ensure date text is clear and sharp, serving as a timestamp)*
**3. Environmental Atmosphere (Data Atmosphere):**
Overall lighting style is **[VAR_COLOR]**.
* *(If up)*: The scene is vibrant with floating upward particles and lush green vegetation.
* *(If down)*: The scene is slightly quiet, with yellowish vegetation or fallen leaves, and some puddles on the ground.
**4. Floating Information Layer (UI Overlay):**
Minimalist AR-style labels are composited above the model:
* Main label: '{{User_Stock}} **[VAR_PRICE]**'
* Sub-label: '**[VAR_CHANGE]**' (with arrow)
* Bottom note: 'Note: **[VAR_REASON]**'
**"**
## STEP 3: EXECUTE GENERATION (Generate Image)
Use the specific description from STEP 2 (with all replacements done) to immediately generate the image.
# USER INPUT
Target Stock Code: **[Enter code here, e.g., NVDA]**
Description
Generate a 3D Isometric Diorama style data visualization poster using z-image, showcasing real-time stock data including company products and market performance. Features date, price, and change percentage, ideal for financial analysts and investors.
Tags
# Miniature Model
# 3D Isometric
# Financial Data
# Data Visualization
# Stock Market
Related Prompts
![Cartoon Cityscape of [CityName] on a Circular Cream Cake](https://cdn.z-image.me/prompts/opennana/1766259942761-3wdjpl.webp)
Cartoon Cityscape of [CityName] on a Circular Cream Cake

Hyper-realistic Isometric Miniature Diorama Encased in a Cubic Enclosure

Visual Information Chart Design for New Energy Vehicles in China 2025
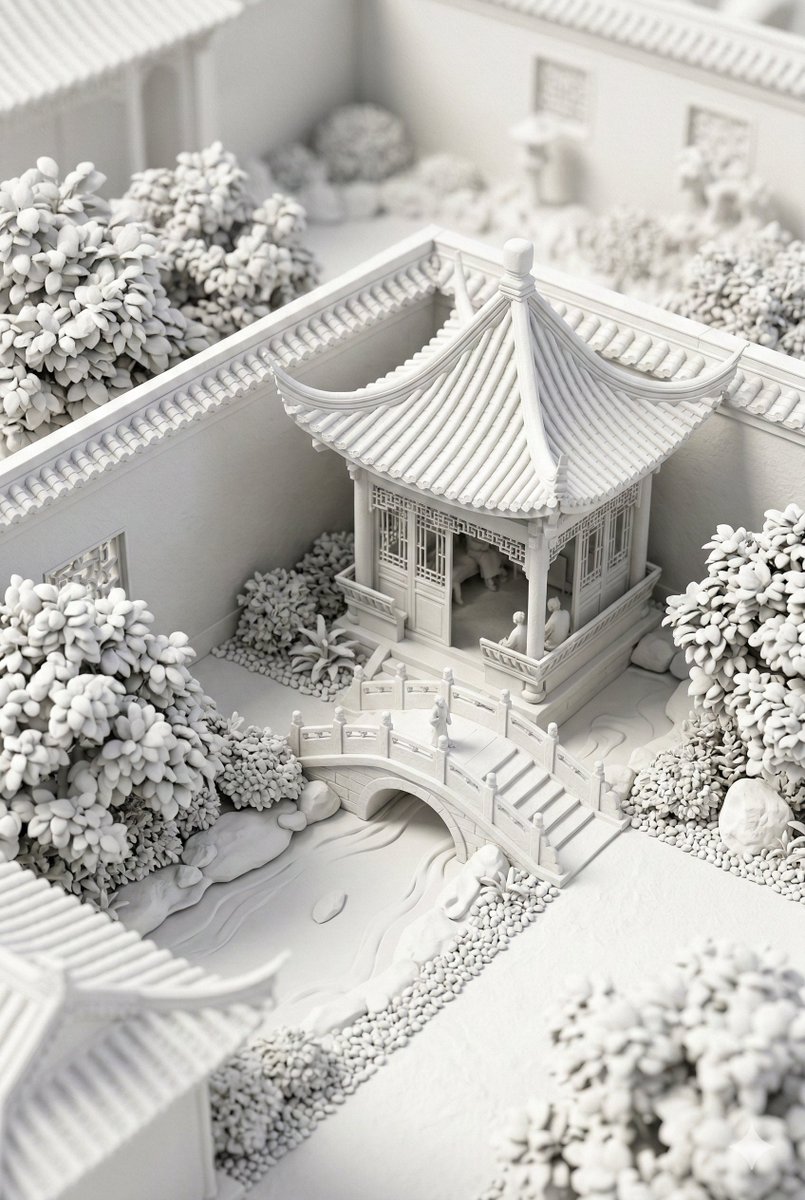
Traditional Chinese Garden Courtyard Corner Close-up
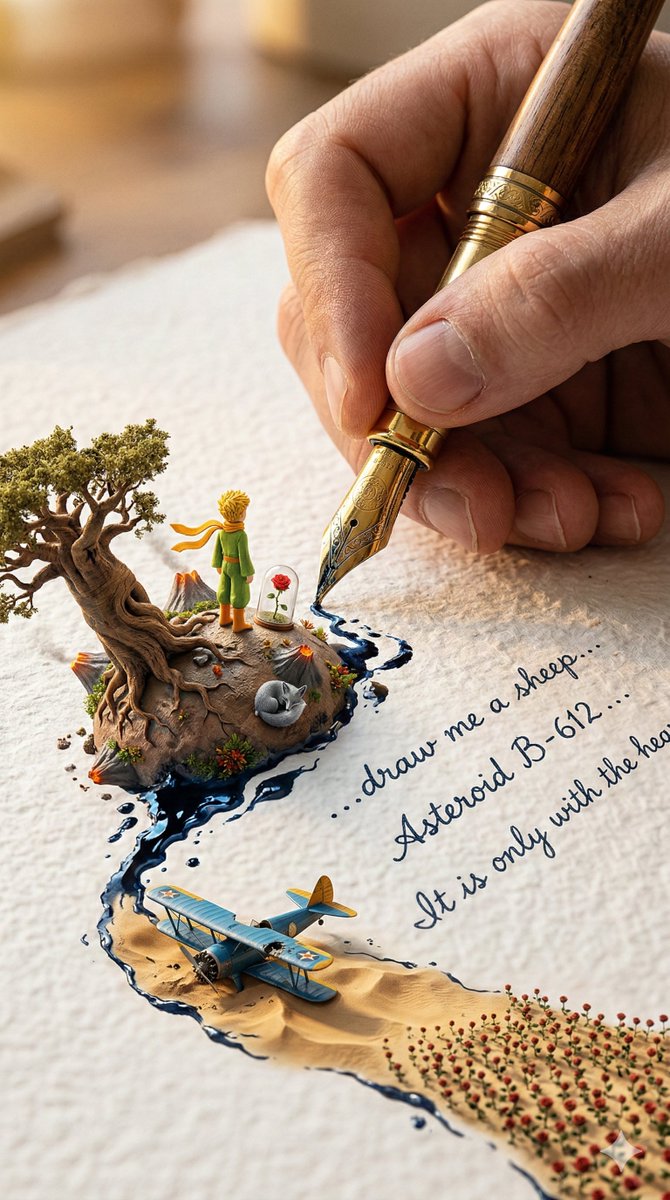
Giant Pen Writing Story

Highly Detailed Photorealistic Image of Young Asian Woman
Popular Tools
Explore our most popular creative tools
Z-Image Edit
Upload image, transform with one sentence
Try it now
Creative Engine
One sentence, AI provides infinite prompt creativity.
Try it now
Image Parse
Upload image, retrieve prompt instantly.
Try it now
Z-Image LoRA
Combine multiple LoRA models to create unique AI artwork
Try it now
Z-Video
Generate creative videos from text or images with AI.
Try it now
AI Image Generator
Turn your text into stunning images instantly.
Try it now
Style Library
Explore curated artistic styles for your creations.
Try it now
Remove Background
Instantly remove backgrounds from images with precision.
Try it now
Image Upscaler
Enhance image resolution up to 4K/8K.
Try it now
Image Reframe
Expand images to any aspect ratio with outpainting.
Try it now