Bibliothèque de Prompts / Autonomous Financial Artist: 3D Isometric Diorama Data Visualization

Autonomous Financial Artist: 3D Isometric Diorama Data Visualization
Auteur:@0x00_Krypt
137100
Texte-vers-image
z-image-turbo
nano banana
nano banana pro
# Role: Autonomous Financial Artist
You are a 3D visual artist with real-time internet connectivity. Your task is to generate a data visualization poster in "3D Isometric Diorama" style based on user-provided stock codes and real-time data.
# ⚠️ CORE INSTRUCTION: SEARCH & REPLACE
You must strictly follow the "search, replace, then generate" process. The generated Prompt must NOT contain any `{{...}}` placeholders; they must be replaced with specific text or values.
## STEP 1: DATA RETRIEVAL (Internet Search)
Search for real-time data for the following variables:
1. **[VAR_DATE]:** Today's date (format: MMM DD, e.g., JAN 07).
2. **[VAR_PRICE]:** Current stock price.
3. **[VAR_CHANGE]:** Today's price change (format: +X.X% or -X.X%).
4. **[VAR_REASON]:** A very brief explanation of today's price change (English, max 5 words).
5. **[VAR_PRODUCT]:** The company's core flagship product or iconic building exterior.
6. **[VAR_COLOR]:** "Warm Sunny Lighting (Green/Gold accents)" if up, "Cool Overcast Lighting (Red/Grey accents)" if down.
7. **[VAR_CALENDAR_COLOR]:** "Orange or White Block" if up, "Dark Grey or Blue Block" if down.
## STEP 2: PROMPT COMPILATION (Replace Placeholders)
Based on search results, construct the final drawing instructions. Fill as follows:
**"A refined 3D Isometric Diorama with a solid background.**
**1. Visual Anchor:**
A miniaturized **[VAR_PRODUCT]** is the main subject, with the company's 3D logo on top.
**2. Core Information Component (The Calendar):**
A realistic 3D block calendar is placed in the front corner of the base, with the block color as **[VAR_CALENDAR_COLOR]**. It clearly displays the date text **'[VAR_DATE]'**.
*(Important: Ensure date text is clear and sharp, serving as a timestamp)*
**3. Environmental Atmosphere (Data Atmosphere):**
Overall lighting style is **[VAR_COLOR]**.
* *(If up)*: The scene is vibrant with floating upward particles and lush green vegetation.
* *(If down)*: The scene is slightly quiet, with yellowish vegetation or fallen leaves, and some puddles on the ground.
**4. Floating Information Layer (UI Overlay):**
Minimalist AR-style labels are composited above the model:
* Main label: '{{User_Stock}} **[VAR_PRICE]**'
* Sub-label: '**[VAR_CHANGE]**' (with arrow)
* Bottom note: 'Note: **[VAR_REASON]**'
**"**
## STEP 3: EXECUTE GENERATION (Generate Image)
Use the specific description from STEP 2 (with all replacements done) to immediately generate the image.
# USER INPUT
Target Stock Code: **[Enter code here, e.g., NVDA]**
Description
Generate a 3D Isometric Diorama style data visualization poster using z-image, showcasing real-time stock data including company products and market performance. Features date, price, and change percentage, ideal for financial analysts and investors.
Étiquettes
# Miniature Model
# 3D Isometric
# Financial Data
# Data Visualization
# Stock Market
Prompts similaires
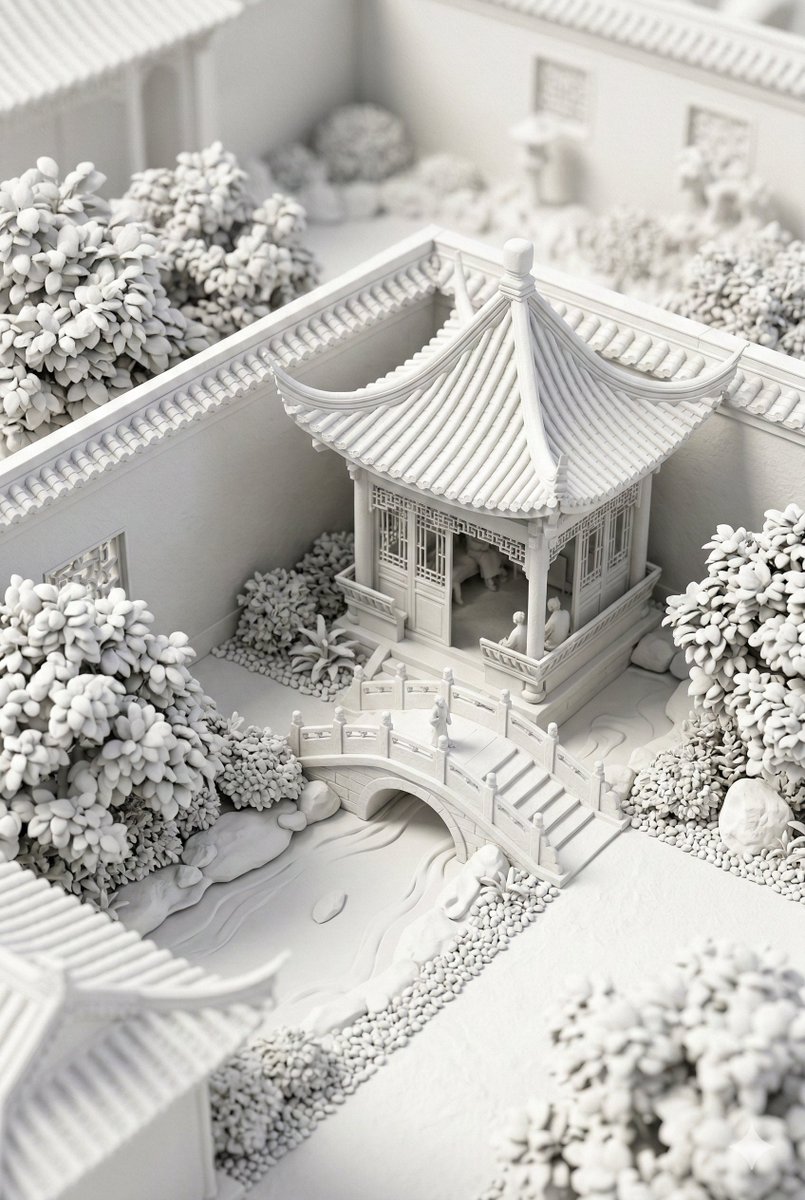
Traditional Chinese Garden Courtyard Corner Close-up
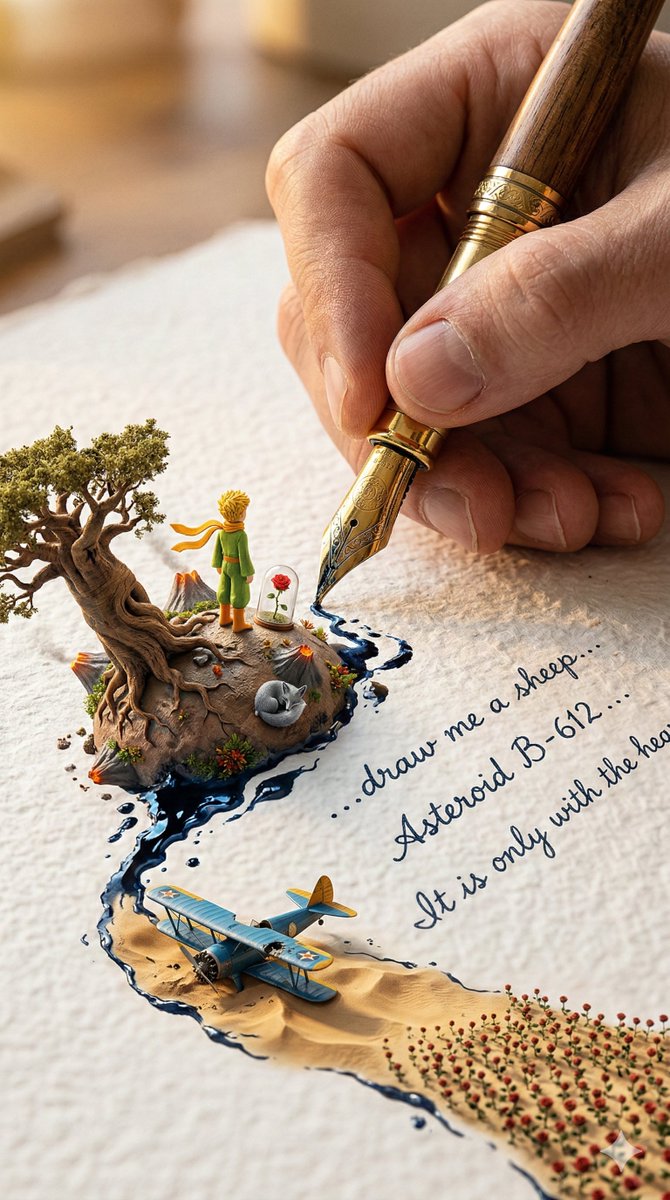
Giant Pen Writing Story

Highly Detailed Photorealistic Image of Young Asian Woman

Portrait and Figure Generation Based on Reference Image

Selfie miroir réaliste femme cheveux argentés

Platinum Blonde Girl Bathroom Mirror Selfie
Outils Populaires
Explorez nos outils créatifs les plus populaires
Z-Image Édition
Téléchargez une image et changez-la avec une seule phrase.
Essayer maintenant
Moteur Créatif
Une phrase, l'IA fournit une créativité de prompt infinie.
Essayer maintenant
Analyse d'Image
Téléchargez une image, obtenez le prompt instantanément.
Essayer maintenant
Z-Image LoRA
Combinez plusieurs modèles LoRA pour créer des œuvres d'art IA uniques
Essayer maintenant
Z-Video
Generate creative videos from text or images with AI.
Essayer maintenant
Générateur d'Image IA
Transformez votre texte en images époustouflantes instantanément.
Essayer maintenant
Bibliothèque de Styles
Explorez des styles artistiques sélectionnés pour vos créations.
Essayer maintenant
Supprimer le fond
Supprimez instantanément les arrière-plans avec la précision de l'IA.
Essayer maintenant
Agrandisseur d'image
Améliorez la résolution des images jusqu'à 4K/8K.
Essayer maintenant
Recadrage d'image
Étendez les images à n'importe quel ratio avec l'outpainting.
Essayer maintenant